Get in touch: +1 888 453 5021


Pre-vet students often look at a 4% acceptance rate and convince themselves they don't have a chance. I see it all the time. But that number is misleading, and building your school list around it is one of the fastest ways to fill your application with long-shot schools while overlooking the programs where you'd actually be competitive.
What many pre-vet students don’t realize is the advantage they hold by applying to vet programs in their state. Out-of-state acceptance rates are often a fraction of in-state ones.
I gathered the acceptance rate data for every accredited vet program in the U.S. and broke it down by residency status, application volume, and average GPA so you can see what your real odds look like at each school.
Here are the acceptance rates for all 38 accredited vet programs in the U.S.:
I used Acceptance Data (Prior Year) figures from the Veterinary Medical School Admission Requirements (VMSAR). I also used Vet School Bound to find the in-state and out-of-state acceptance rates. Since the VMSAR doesn’t list the number of offers of acceptance, I calculated the acceptance rates in this table by dividing the number of matriculated students by the number of applications.
Acceptance rates alone don't tell the full story. Several factors change your actual odds well beyond what a single number suggests.
Your state residency is the single biggest variable in your actual odds of acceptance. Colorado State's overall acceptance rate is 4.81%, with in-state at 22.36% and non-resident at 1.75%. In-state applicants face odds that are about 13 times those of non-residents.
This residency advantage holds for nearly every public vet program in the U.S. Oregon State enrolled 48 of 148 resident applicants (32.43%) versus 48 of 2,115 non-resident applicants (2.27%). North Carolina State enrolled 100 of 428 residents (23.36%) compared to 25 of 1,671 non-residents (1.50%). In-state applicants consistently face odds 10-15 times better than out-of-state applicants at the same school.
Around 18 states still have no vet school at all. If you live in one of those states, look into WICHE (Western Interstate Commission for Higher Education) or SREB (Southern Regional Education Board) contract seat programs.
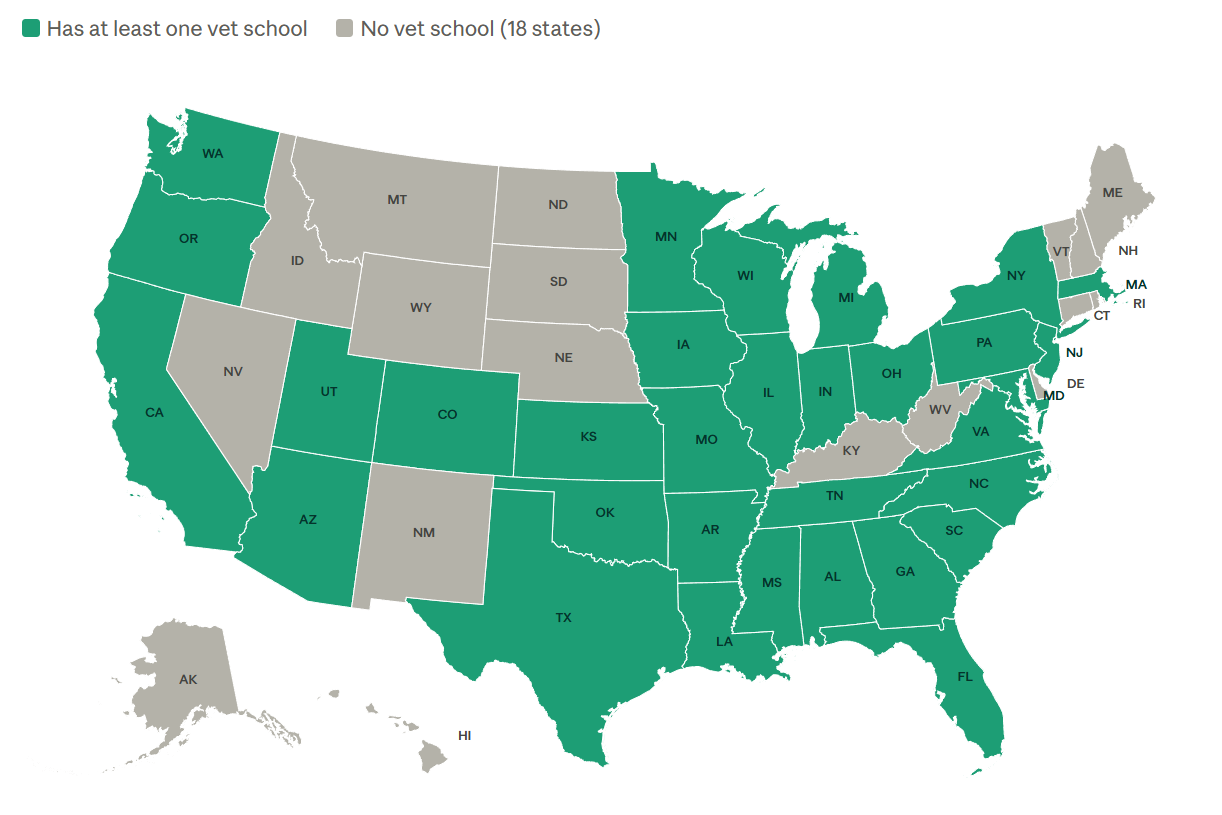
These regional agreements reserve funded seats at partner schools for residents of states without their own DVM programs. They also give applicants preferential consideration for admission and reduced tuition.
WICHE's participating vet schools (Colorado State, Oregon State, and Washington State) use a cooperative admissions process that identifies supported applicants before issuing acceptance offers.
Class size is relatively fixed at most vet schools, so the acceptance rate largely reflects how many people applied in that admissions cycle. Oregon State's 3.94% rate looks more selective than Oklahoma State's 19.67%, but the difference is almost entirely about demand:
Vet programs at flagship universities tend to attract larger applicant pools, lowering their overall acceptance rates. Smaller or newer programs often show higher acceptance rates, not because they admit weaker candidates, but because fewer people apply.
Don't only use acceptance rate as an indicator of program quality or your personal odds of getting accepted.
Four programs haven't published admissions data yet because they're still enrolling their first or second classes. New programs change the data in two ways.
First, they increase the total number of available seats nationally, which might eventually lessen competition at other schools. Second, they create new in-state residency advantages for students in states that previously had no vet school. For example, residents of Arkansas and South Carolina recently gained their first in-state options.x
The average matriculant GPA across our dataset ranges from 3.27 to 3.88. Most programs land between 3.55 and 3.80. But most vet programs see your prerequisite coursework grades and GPA as a threshold, not a differentiator.
Once you clear a program's minimum competitive GPA (typically around 3.50 for most schools), the admissions committee looks at everything else in your application. Veterinary experience hours, letters of recommendation, your personal statement, community involvement, and interview performance all factor into your odds of admission.
In our vet school webinar, Dr. Caitlin Passaro, an Inspira Advantage expert who earned a DVM from North Carolina State University, shares her perspective on GPA and course grades.
"Take challenging science courses to demonstrate your academic readiness ... Prioritize quality, so if you can't take those upper-level courses, at least do really well in your prerequisites,” she says. “Don’t just take extra courses [to look good] and do poorly in them.”
Programs at Western University and the University of Arizona show that schools with lower GPA averages aren’t necessarily easier to get into. They may just weigh experience and mission fit more heavily than academics.
The Veterinary Medical College Application Service (VMCAS) provides the same set of application components to all applicants, but each program scores them differently.
Some weigh the prerequisite science GPA more than the cumulative GPA. Others prioritize large-animal experience or rural backgrounds. Research each program's evaluation criteria directly rather than assuming that a high GPA alone increases your chances of acceptance.
Check out the video below for a comprehensive look at the entire vet school application process:
Every year, I sit down with pre-vet students who created their entire school list around acceptance rates. And every year, I have to fix the same mistake.
So many in-state applicants see an overall acceptance rate of 4.81% and just don’t bother applying. But then they skip the program where they have the strongest chance of getting accepted because of their location.
I've also seen the opposite mistake just as often. Students who apply to a vet program with a 20% acceptance rate think they’re a shoo-in, so they submit a subpar application because they thought the numbers would guarantee them a seat.
Acceptance rates are great — but only if you understand what they're actually measuring. The breakdown below shows you how to read these numbers the way admissions data is meant to be read.
Acceptance rates measure demand at a program, not your personal odds of getting in. A school reporting a 4% admission rate and one reporting a 20% admission rate aren’t five times harder or easier to enter for your specific profile. Your residency status, GPA, veterinary experience, and alignment with a program's mission matter far more than the aggregate number.
Per-school rates look more intimidating than they should because most applicants apply to multiple programs. According to the AAVMC's 2024-2025 Institutional Data Report, the VMCAS received 10,880 applicants in a recent cycle, yet programs like Colorado State, Ohio State, and North Carolina State each received over 2,500 applications on their own.
The same applicant gets counted in the denominator at every school they applied to, which makes each program's individual rate appear lower than their actual chances across the system.
Compare the total number of applicants against class size to understand how much competition each program attracts; then check the average matriculant GPA to see what your target should be.
A school like Oklahoma State operates in a completely different competitive environment than Oregon State, even though both produce qualified veterinarians.
Here’s a comparison of Oklahoma State and Oregon State’s acceptance rates for their vet programs.
To compare vet programs using admissions statistics, start with the residency status. Before comparing any other metric, determine whether you qualify as an in-state applicant at each school on your list. Check each program's residency requirements and contract state agreements through the VMSAR before building your list.
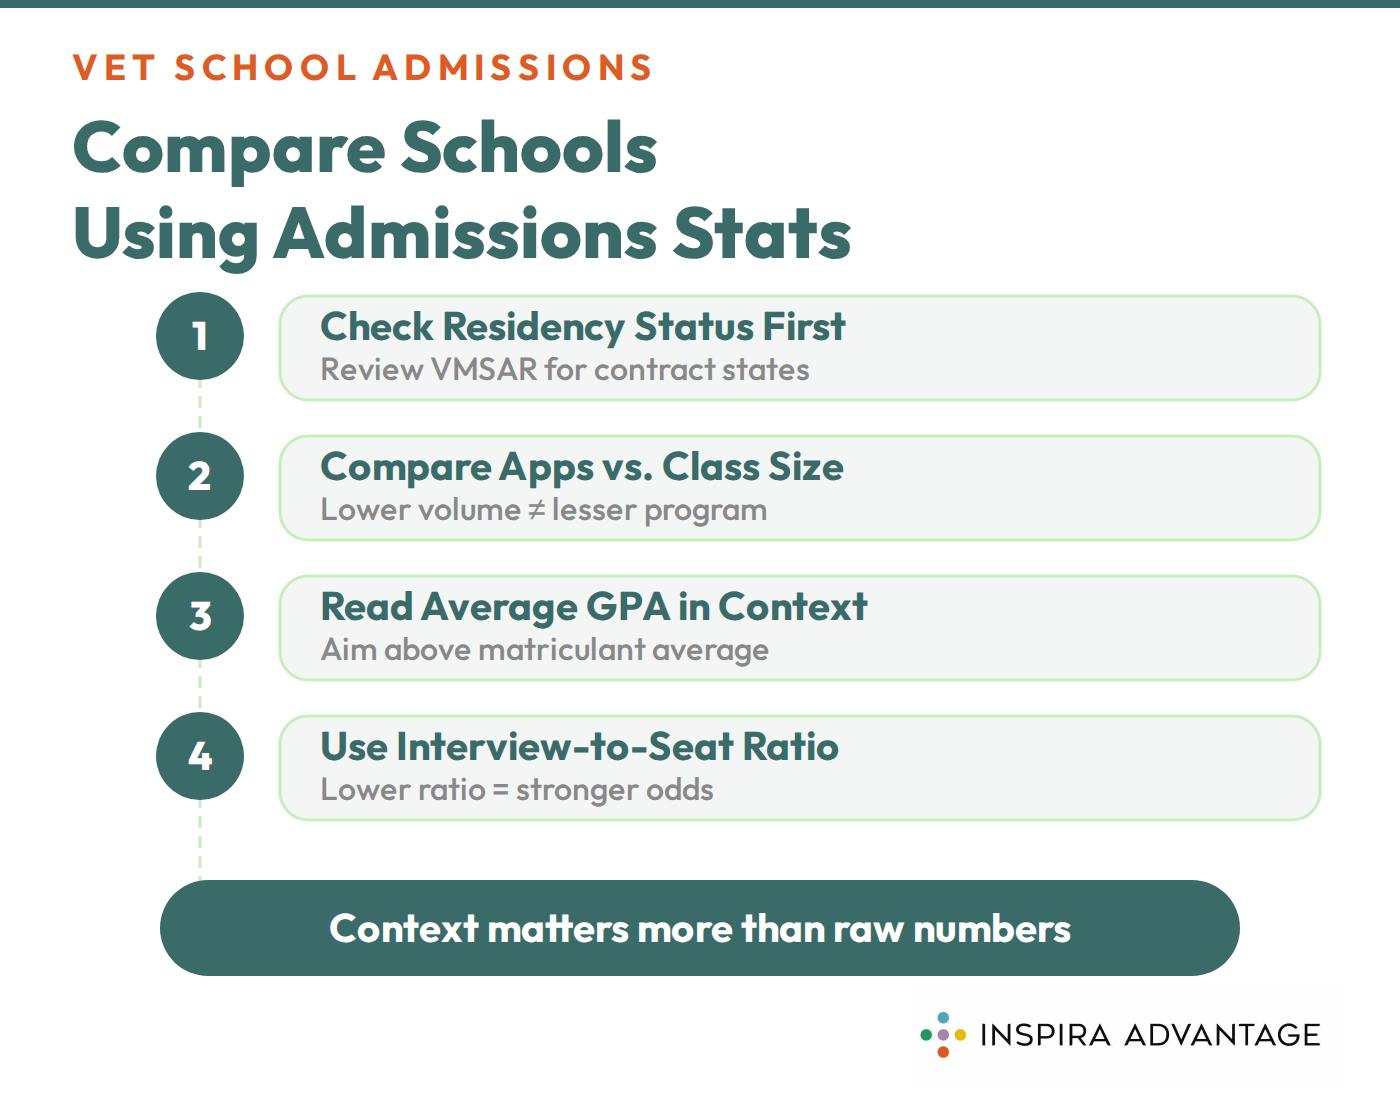
Compare the number of applications a school receives with the number of students it enrolls. Oregon State received 2,361 applications for 93 seats. Oklahoma State received 539 applications for 106 seats. Both produce graduates who pass the North American Veterinary Licensing Examination (NAVLE) and enter practice, but the volume at each school creates a fundamentally different admissions environment.
Schools with lower application volume aren’t lesser programs. They’re programs where fewer people compete for each available seat.
The average matriculant GPA for each vet program reflects the competitive baseline for enrolled students, not the minimum required to get in. Choose schools where your overall GPA falls above the school’s matriculant average.
Programs with lower average GPAs aren’t less competitive overall. They typically place greater weight on veterinary experience, community involvement, and mission alignment in their evaluation.
Several schools in our table publish the number of applicants they interview. Use that number as a middle checkpoint between applications and matriculants, but pay attention to which stage of the funnel it shows.
In our webinar on preparing for vet school interviews, Dr. Leslie Starnes, an Inspira Advantage counselor and graduate of Auburn University’s vet program, shares her insights on making it to the interview stage.
"Making it to the interview stage is such a huge next step because when you think about the numbers in vet med applications, they literally have thousands of applications ... I'm talking upwards of 9,000 applications usually in total for all the vet schools,” she says. “Out of those applicants, they narrow it down to around 400 per school for interviews ... and then on top of that, they narrow the 400 to 100-150 seats per school."
Kansas State interviewed 450 applicants out of 2,350 applications and enrolled 120. Michigan State interviewed just 218 out of 1,932 and enrolled 115. Kansas State invites a larger share of its applicant pool to interview (19.1% vs. 11.3%), which means your odds of reaching the interview stage are better there.
But Michigan State converts a higher percentage of interviewees into enrolled students (52.8% vs. 26.7%), which means once you land the interview, you face less competition for a seat.
When interview numbers are available, calculate both rates. The interview rate (interviews divided by applications) indicates how aggressively a school screens applicants before the interview. The conversion rate (matriculants divided by interviews) tells you how much the interview itself determines the final decision.
If you need advice on how to prepare for your vet school interviews, take a look at the video below:
Use acceptance rates as tools to strengthen your application by assessing which schools you’re competitive at. Numbers can’t tell the full story, but they can help you build your school list.
Start your school list by adding the programs where you qualify as a resident applicant. If your state has a vet school, that program should be at the top of your list, regardless of its overall acceptance rate. If your state doesn’t have a vet school, check whether it participates in WICHE or SREB contract seat agreements before applying as a general out-of-state candidate.
After choosing your local schools, add out-of-state programs where the data works in your favor. Schools with higher acceptance rates and lower application volumes face less competition per seat. These are programs where the numbers give you more room to stand out through your application, rather than getting lost in a large applicant pool.
Use the GPA column to sort programs into three tiers relative to your own numbers:
Research which programs weigh prerequisite science GPA separately from cumulative GPA, since a strong science record can offset a lower overall number at schools that evaluate them independently.
Think about what happens on the other side of your application. At a school that receives over 2,500 applications, the admissions committee has to move quickly during the initial screening process.
Your personal statement and experience descriptions need to land quickly because the reviewer might spend only a few minutes on each file before deciding who advances. Highlight your strongest quantitative credentials at these high-volume programs because those numbers drive the first cut.
At schools getting fewer than 1,000 applications, the admissions committee might have more time to spend on your application review. So as long as you meet the minimum academic thresholds, the reviewer might spend more time on your story, your background, and the way you describe why veterinary medicine matters to you.
Tuskegee University has the highest acceptance rate among U.S. veterinary schools at 21.27%. Tuskegee University receives significantly fewer applications than most other schools, which drives the higher rates rather than any difference in academic standards.
The vet program that’s hardest to get into is Oregon State University, with an acceptance rate of 3.94%. However, in-state residents have a 32.43% acceptance rate at Oregon State University. So, applying as a resident to competitive vet schools improves your odds of admission.
Yes, in-state applicants have significantly better odds at nearly every public veterinary program. Colorado State enrolled 22.36% of resident applicants, compared to just 4.81% of non-resident applicants. In-state applicants face odds more than 14 times those of non-residents in that program, and similar gaps exist across most public schools.
The average acceptance rate across the 34 U.S. veterinary programs with published data is approximately 7.52%. Your actual odds depend on which schools you apply to and whether you qualify as a resident applicant.
A low acceptance rate doesn’t indicate a better program. It reflects a higher application volume relative to the number of available seats. Oregon State's 3.94% rate and Colorado State's 4.81% rate result from each school receiving over 2,000 applications for fewer than 160 seats. Programs with higher acceptance rates, like Oklahoma State and Tuskegee, simply attract smaller applicant pools, not weaker students.


.svg)


