The table above breaks down acceptance rates for every medical school in the United States based on applications received and total matriculants, which is the only admissions data schools publicly report. In-state and out-of-state acceptance rates are included to help you gauge how much geographic residency affects your odds at each program. All figures come from the Association of American Medical Colleges (AAMC) 2025 Facts Sheet.
Privacy guaranteed. No spam, ever.
Factors Influencing Trends in Medical School Acceptance Rates
Acceptance rates shift year over year based on structural and demographic forces, not just how "hard" schools become. Key factors that drive these trends include:
Applicant volume: Total applications rose 5.3% in 2025 to 54,699, driven by an 8.4% increase in first-time applicants. More applicants competing for the same seats pushes individual school rates down.
New medical schools and expanded class sizes: The 2025 entering class of 23,440 was the largest in history, and total enrollment surpassed 100,000 students for the first time. New schools and larger classes gradually increase the total number of available seats.
State residency policies: Public schools reserve the majority of seats for in-state residents, creating dramatically different effective rates for in-state vs. out-of-state applicants at the same institution.
Grade inflation and rising MCAT scores: The mean matriculant GPA climbed to 3.81 in 2025 (up from 3.79 in 2024), and the mean MCAT reached 512.1 (up from 511.8). Rising academic benchmarks make each cycle incrementally more competitive on paper.
Post-affirmative action admissions shifts: Following the 2023 Supreme Court decision, matriculants from several historically underrepresented groups declined, changing the composition of entering classes at many schools.
Application behavior: Applicants have been applying to 15-20+ applications each in recent cycles, inflating individual school application counts and driving published rates lower.
Privacy guaranteed. No spam, ever.
Why Medical School Acceptance Rates Can Be Misleading and What The Data Actually Means
Most published "acceptance rates" are actually "matriculant" enrollment rates. Schools report enrollment data to the AAMC, which tracks how many students actually entered the incoming MD class, not how many applicants received an offer of admission.
Applicant volume also skews the numbers. George Washington University School of Medicine received 17,194 applications for 130 seats, producing a 0.76% acceptance rate that appears more selective than Harvard Medical School (8,275 applications, 1.99%).
High application volume alone pushes these rates down, regardless of how rigorous the admissions standards actually are.
Your state of residency is another factor that affects your chances of getting into med school. Public medical schools reserve the majority of their seats for residents, meaning a small slice of the applicant pool claims most of the class.
At Indiana University School of Medicine, for example, in-state residents made up just 8.80% of applicants, had a matriculation rate of 46.08%, and filled 86.60% of the entering class. Out-of-state applicants, who made up the remaining 91.20% of the pool, matriculated at just 0.69%.
Five schools accepted zero out-of-state students: East Carolina University Brody School of Medicine, Mercer University School of Medicine, Southern Illinois University School of Medicine, University of Mississippi School of Medicine, and Washington State University Elson S. Floyd College of Medicine.
Privacy guaranteed. No spam, ever.
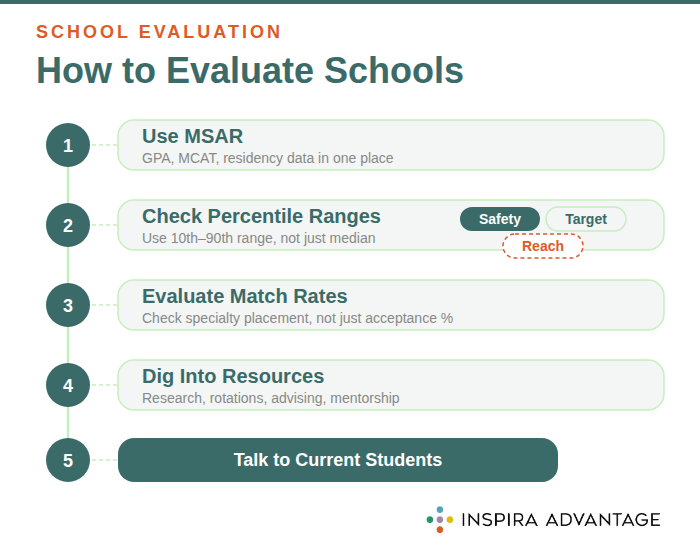
How to Evaluate Medical Schools Using Admissions Data (Checklist)
Use admissions data to filter schools by residency status and academic percentiles first, then layer in match outcomes and school-specific resources. Here are the exact steps to do this effectively:
Use MSAR to Build a Medical School List That Matches Your Profile
For a full breakdown of how to use the MSAR database to find medical schools that match your profile, check out our guide. The MSAR database is the single most useful tool for evaluating schools, and most applicants underuse it.
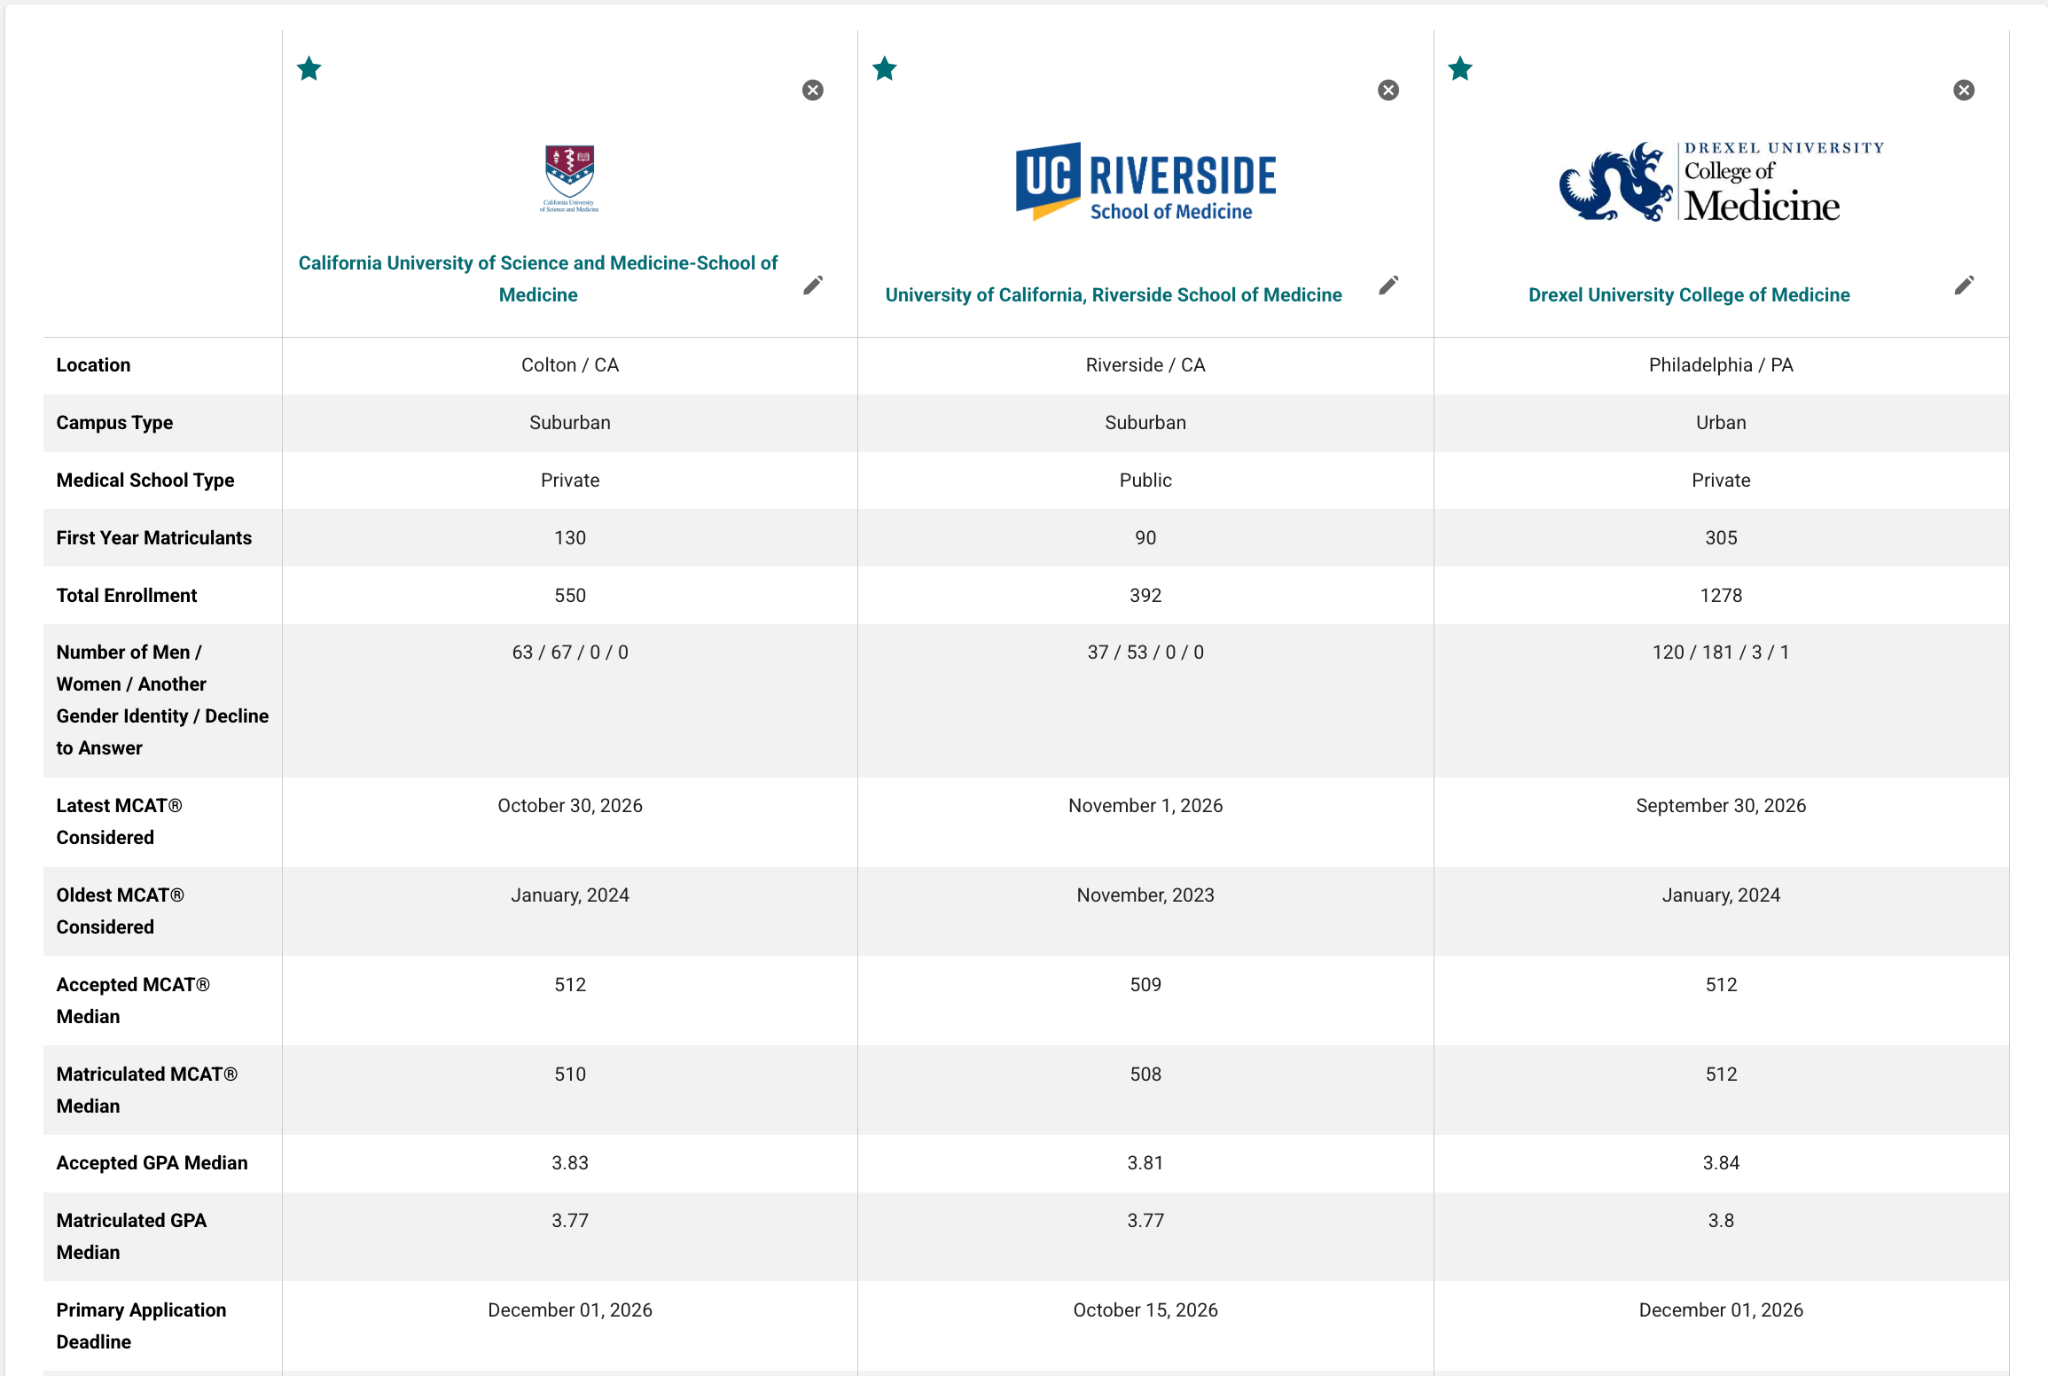
The MSAR lets you compare every school you are interested in against each other, with:
GPA and MCAT ranges
In-state vs. out-of-state enrollment breakdowns
Class size
Demographic data
Source:MSAR
The MSAR lets you compare every school you are interested in against each other, with:
GPA and MCAT ranges
In-state vs. out-of-state enrollment breakdowns
Class size
Demographic data
After this, you can then categorize your list into three tiers: target schools where you fall near the median, reach schools where you fall in the lower quartile, and safety schools.
Evaluate GPA and MCAT Percentiles Carefully to Determine Your True Competitiveness
Look at the 75th-90th percentile GPA and MCAT range, not the median. Falling at a school's 50th percentile means half the admitted class had stronger numbers than you.
Scoring at or above the 75th percentile is where your odds improve meaningfully, because the school has already demonstrated a pattern of admitting applicants at your level.
A school reporting a median MCAT of 515 might admit students scoring anywhere from 508 to 521. Use that full 10th-to-90th percentile range in MSAR to categorize each school honestly.
If your scores land above the 75th percentile, that school is a safety. Between the 25th and 75th, it is a target. Below the 25th percentile, it is a long reach regardless of how many secondary essays you perfect.
Consider Residency Match Rates Along With Acceptance Rates
Acceptance into medical school is an intermediate step, not the finish line. Where you match for residency determines your specialty, your training environment, and your earning trajectory. Before committing to a school, look for its published match list if one is available.
Many schools voluntarily post where their graduates matched by specialty and program on their websites, but availability varies, and there is no single centralized database that tracks match outcomes by medical school.
A school with a 5% acceptance rate and weak placement in your preferred specialty serves you worse than a school with a 10% rate that consistently sends graduates into competitive residency programs. When a school publishes its match list, check whether graduates are landing in the specialties and program tiers you care about.
Use Student Demographics and School Resources to Narrow Your List
Once you have a short list of schools, dig into the details that admissions data cannot capture. Check whether the school has research opportunities in fields you care about. A student interested in oncology research, for example, benefits more from a school affiliated with an NCI-designated cancer center than one without dedicated research infrastructure.
Look at where clinical rotations happen. A school with rotations spread across a major academic hospital system gives you different exposure than one relying on a single community hospital. Find out if the school offers advising specific to your target specialty, structured board prep, or mentorship programs.
Reach out to current students or recent graduates on LinkedIn or through the school's admitted student events. Ask whether advising actually helped their residency applications, how accessible faculty mentors are, and what surprised them most about the program. Published data gets you to a short list.
Conversations with real students tell you whether a school belongs on your final list.
Privacy guaranteed. No spam, ever.
How to Increase Your Chances of Getting Into Medical School Using Acceptance Rate and Admissions Data
To increase your chances of getting into medical school, use acceptance rate and admissions data to build a strategically balanced school list and understand what the numbers can and cannot do for your application.
Aim to Apply to Around 30 Schools and Use the Lizzy M Score to Help Sort Them
Most applicants either apply too narrowly (10 to 15 dream schools) or too broadly (40+ schools with no strategic logic).
Dr. Katherine Munoz, an Inspira Advantage advisor who’s served on medical school admissions committees for five years, recommends a list of roughly 30 schools divided into three tiers: 5 to 10 reach schools where your stats fall below the median, 5 to 10 safety schools where your numbers exceed the average matriculant, and the rest in your target range.
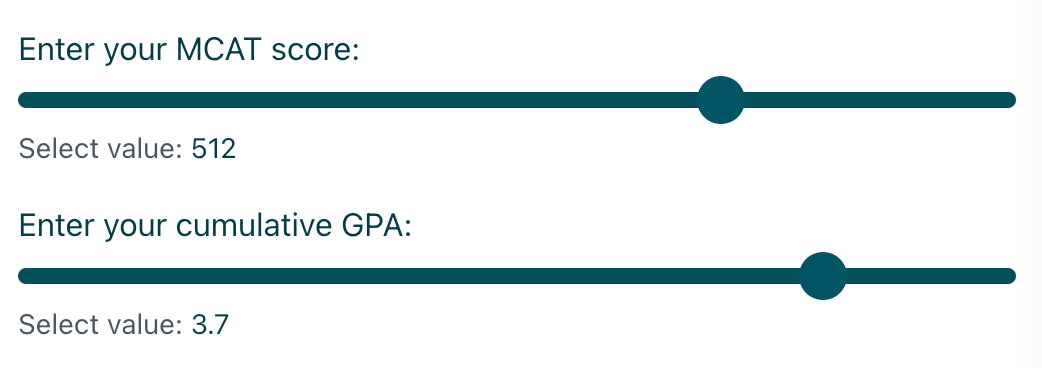
In our AMA webinar, Dr. Munoz recommends the Lizzy M score to help you sort schools into these tiers quickly. Created by LizzyM, a medical school admissions committee member and long-time Student Doctor Network contributor, the score combines your GPA and MCAT into a single reference number.
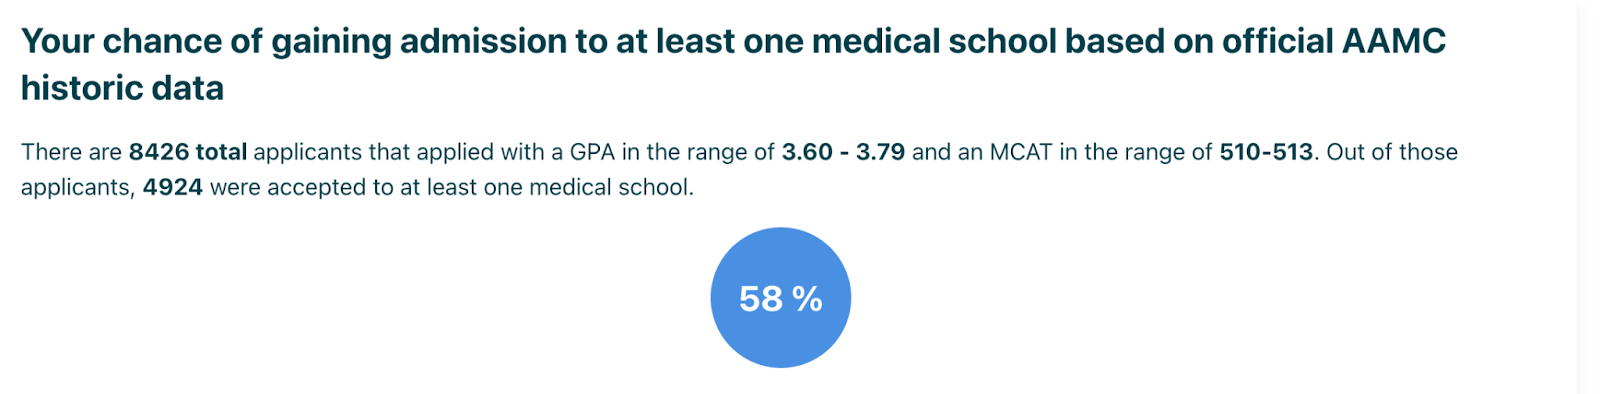
SDN's LizzyM Application Assistant calculator lets you enter your GPA and MCAT, then shows you what percentage of applicants with similar credentials were accepted to at least one medical school based on historical AAMC data.
The data is not from the current-cycle, but it still provides a useful baseline for gauging where your academic profile falls relative to historical applicant pools. Only use this score as a first-pass filter for building your list, not as a final prediction of whether you will get in.
A strong narrative and compelling experiences can absolutely overcome a lower Lizzy M, but a high Lizzy M will not save an application with other weak components.
Know That High GPA and MCAT Scores Get Your Application Reviewed, Not Accepted
GPA and MCAT scores that match or exceed a school's admitted students’ 50th-75th percentiles typically get you past the initial screening. After that point, the numbers stop doing the work for you.
In our How to Plan for Med School Acceptance webinar for pre-meds, Dr. Austin Johnson, a Dermatology resident at Stanford Med and admissions expert at Inspira, explains that strong metrics function as a threshold to get your application into the review pile, not a guarantee of admission.
Understanding how schools use acceptance rate data at each stage matters here. Many schools run an initial screen that filters out applicants below certain GPA and MCAT cutoffs before a human ever reads the application. If your numbers clear that filter, you enter the same review pool as everyone else who cleared it.
A 520 MCAT and a 518 MCAT are functionally equivalent once both pass the screen. The difference between getting accepted and getting rejected at that point comes down to your other application components:
Applicants who score well above a school's median sometimes assume the acceptance is nearly automatic and underinvest in those qualitative components.
Look at it from the admissions committee's perspective: if a school receives 10,000 applications and screens for a minimum MCAT of 508, thousands of applicants clear that bar. Everything after the initial screen is a competition between applicants with similar stats, and that competition is won by the strength of your narrative, not another MCAT point.
Work With a Medical School Admissions Expert Who Knows How to Interpret the Data
Acceptance rate data can tell you where you are competitive on paper, but an experienced admissions advisor can show you how to get accepted at schools where your stats alone put you on the edge.
At Inspira Advantage, admissions experts who have served on medical school committees help applicants interpret MSAR data, build strategically balanced school lists, and identify schools where mission alignment, research fit, or clinical experience can compensate for a GPA or MCAT that falls below the median.
If your numbers place you in the lower quartile at a school you care about, the difference between a rejection and an interview often comes down to how well your personal statement, activity descriptions, and secondary essays position you as a match for that specific program.
An advisor who understands how admissions committees weigh stats against narrative can help you make that case in ways that raw data interpretation alone cannot.
Privacy guaranteed. No spam, ever.
FAQs: Medical School Admissions
Which Medical School Is Easiest to Get into in the USA?
Among schools open to out-of-state applicants, the University of Missouri-Kansas City School of Medicine (8.43%), Roseman University College of Medicine (8.08%), and the Uniformed Services University F. Edward Hebert School of Medicine (7.91%) posted some of the highest acceptance rates in 2025-2026.
Mercer University School of Medicine (14.13%) and the Medical College of Georgia at Augusta University (9.03%) post even higher rates, but they enroll almost exclusively in-state students.
Keep in mind that a higher matriculant rate does not mean lower academic standards. The "easiest" school to get into is the one where your GPA, MCAT, and residency status align with the school's historical enrollment profile.
How Hard Is It to Get Into Medical School in the USA?
Getting into medical school is challenging. According to the AAMC, the overall acceptance rate across all U.S. MD-granting schools was approximately 42.90% in the 2025 cycle, meaning roughly 4 out of 10 applicants were accepted to at least one school.
Is a 3.7 GPA Good for Medical Schools in the USA?
Yes, a 3.7 GPA is relatively good for medical schools in the USA. The AAMC reports that 2025 applicants had an average GPA of 3.67, so a 3.7 puts you above this average. However, the average GPA for matriculants was 3.81.
Nonetheless, at many schools, a 3.7 falls between the 25th and 50th percentile of enrolled students, which places you solidly in the target range. A 3.7 becomes more challenging at the most selective programs, like the Ivy League, which favor applicants with 3.9-0-4.0 GPAs.
What GPA Do You Need for the Best Medical Schools in the US?
Top-ranked medical schools typically report median GPAs above 3.9 for their matriculating classes. To be competitive at these programs, aim for a GPA of 3.95 or higher. Falling below this GPA does not make admission impossible, but it places you in the lower percentiles of enrolled students, where your extracurriculars and personal narrative need to carry more weight.
Should You Prioritize In-State Acceptance Rates When Applying?
Yes, you should prioritize in-state acceptance rates if you are applying to public medical schools. In-state residency is a strong predictor of enrollment at public institutions.
In the 2025-2026 AAMC data, 22 public medical schools had entering classes made up of 90% or more in-state students.
Some states enforce in-state preference by law. According to TMDSAS, Texas state law requires that no more than 10% of the entering classes at public medical schools can be non-Texas residents.
Which Admissions Metrics Matter Most for Medical School Selection?
GPA and MCAT are the two metrics that determine whether your application gets reviewed at all. Many schools run automated screens that filter out applicants below internal cutoffs before a human reads the file.
Once you clear that threshold, the weight shifts to qualitative factors: clinical experience, research, letters of recommendation, your personal statement, and interview performance. Strong numbers get you into the review pile. Everything after that is about demonstrating fit, maturity, and a clear understanding of why you want to practice medicine.
Arush Chandna is the Co-Founder of Inspira Advantage and a nationally recognized expert on graduate school admissions. Arush has used his 12+ years of experience in higher education to help 10,000+ applicants get into their dream graduate programs.


.svg)

