Get in touch: +1 888 453 5021





Getting into medical school is difficult, but knowing just how difficult it is for different applicants can help you make a more informed decision.
Nine of the top 10 medical schools admit in-state applicants at higher rates than out-of-state ones - reason enough to rethink your school list. Top DO programs admit students with MCAT scores 15 points below their MD counterparts, which should change how you read your own score.
We looked at the most recent Association of American Medical Colleges (AAMC) data to find the numbers you either don’t know or don’t understand.
Here are the acceptance rates, GPAs, and MCAT scores for the top 10 MD programs in the country:
Where you call home can matter in medical school admissions as much as your MCAT score. Across the top 10 medical schools, residency status changes your odds in ways you might not expect. Here’s how in-state and out-of-state applicants actually fare.
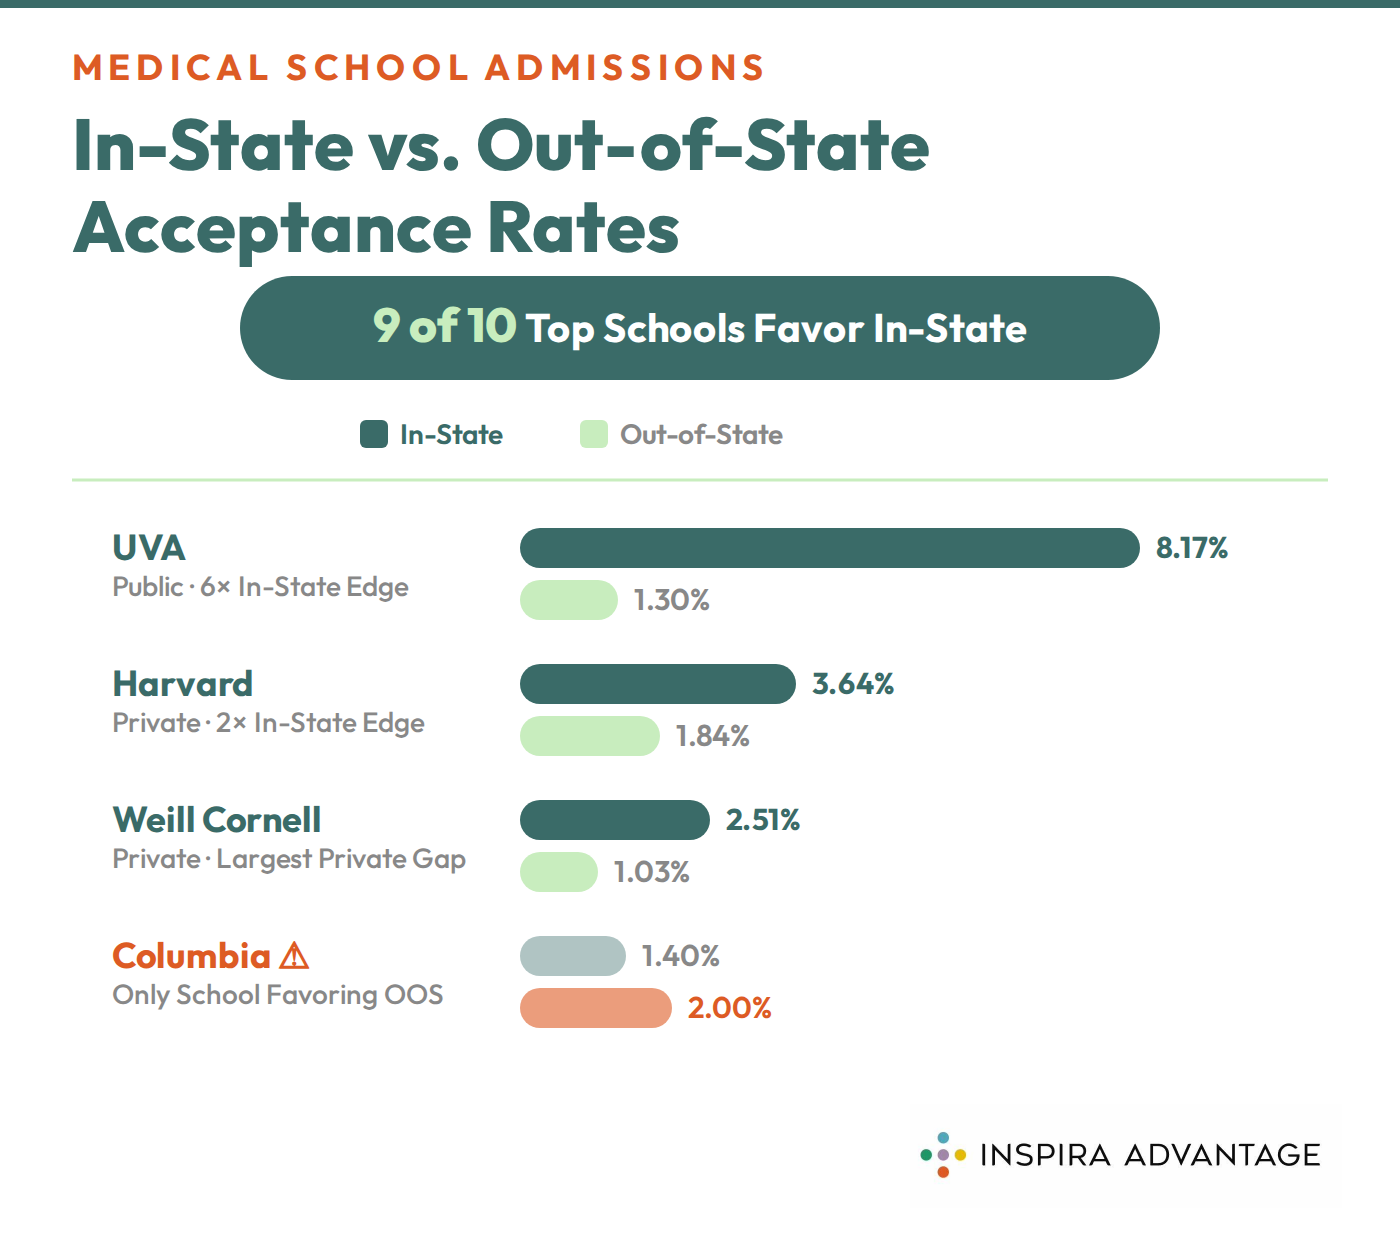
Across the top 10 medical schools, 9 of 10 admit in-state applicants at a higher rate than out-of-state applicants. Columbia is the only top-10 medical school that favors out-of-state applicants, with a range of 2.00% to 1.40%.
The University of Virginia School of Medicine gives more residency spots than any other top school. It admits Virginia residents at 8.17% and out-of-state applicants at 1.30%, making in-state applicants more than six times as likely to get in.
Weill Cornell Medicine shows the largest residency gap among private schools. The program accepts 2.51% of in-state applicants against just 1.03% of out-of-state applicants, a divide that runs counter to the usual private-school pattern of treating residency as a minor factor.
Even the most selective programs reward home-state applicants. Harvard Medical School admits Massachusetts residents at 3.64% and out-of-state applicants at 1.84%, nearly doubling the odds for locals despite Harvard's national appeal.
The private-public divide is staggering at the extremes. UVA's in-state rate of 8.17% sits more than double the highest private in-state rate on the list, showing how state funding pushes public programs to reserve seats for residents.
The numbers separating MD and DO admissions are wider than you might expect. Acceptance rates, MCAT scores, and GPAs all sit lower at top osteopathic programs, but the gap reflects access and mission, not a lower bar for becoming a physician.
Here’s how the two paths compare at the most competitive schools:
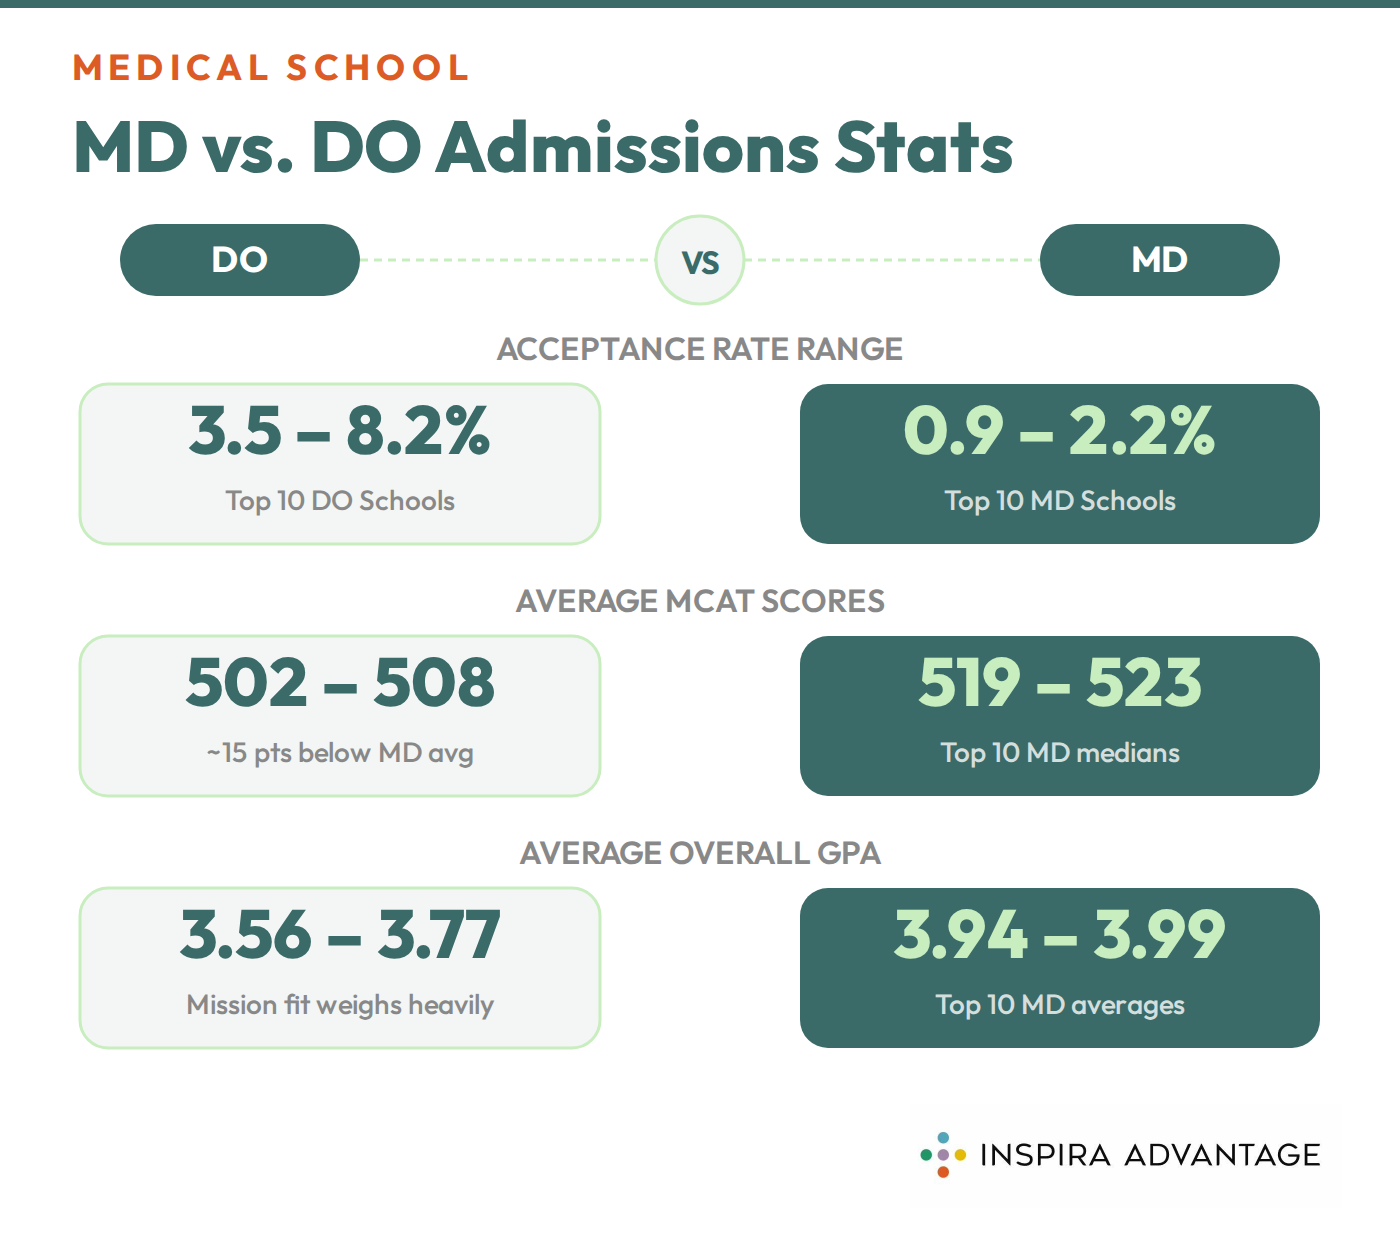
Our top 10 osteopathic schools have acceptance rates ranging from 3.53% to 8.15%, while the top 10 MD schools have acceptance rates ranging from 0.92% to 2.18%.
Even the most competitive DO program on the list, Campbell University at 3.53%, admits a larger share of applicants than the most accessible top MD school, the University of Virginia at 2.18%.
For applicants whose numbers fall short of MD medians, adding osteopathic programs widens the realistic target list without compromising the quality of training.
Top DO programs admit applicants with MCAT scores about 15 points lower and GPAs about a third of a point below their MD counterparts. However, that doesn’t mean getting into a DO school is easy.
DO matriculant stats have increased steadily for a decade as applicant volume grows, so a score that cleared the bar a few years ago now sits closer to the middle of the applicant pool.
Average MCAT scores at these DO schools range from 501.8 to 508, compared with medians of 519 to 523 at the top MD programs. That places top DO averages right around the national MCAT average for all MD applicants, which is 506.3.
A score in the 505 to 508 range keeps you competitive at most osteopathic programs, while having a score over 510 strengthens your file at the more selective DO schools.
Top DO matriculants average 3.56 to 3.77 overall GPAs, while top MD matriculants sit at 3.94 to 3.99. Osteopathic schools weigh mission fit, clinical exposure, and commitment to primary care alongside statistics.
Show that fit through your experiences, not your adjectives. A record in primary care, underserved communities, or hands-on patient contact carries more weight at a DO program than a fractionally higher GPA, so allow your clinical hours and your reasons for choosing osteopathic medicine to anchor your application.
Medical school admissions change with every cycle, and the latest numbers show where the competition already is. Acceptance rates, the gender balance of the applicant pool, the single hardest school to get into, and the scores that separate those who get in from those who don't have all changed over the past few years.
Here’s what the data shows, then and now:
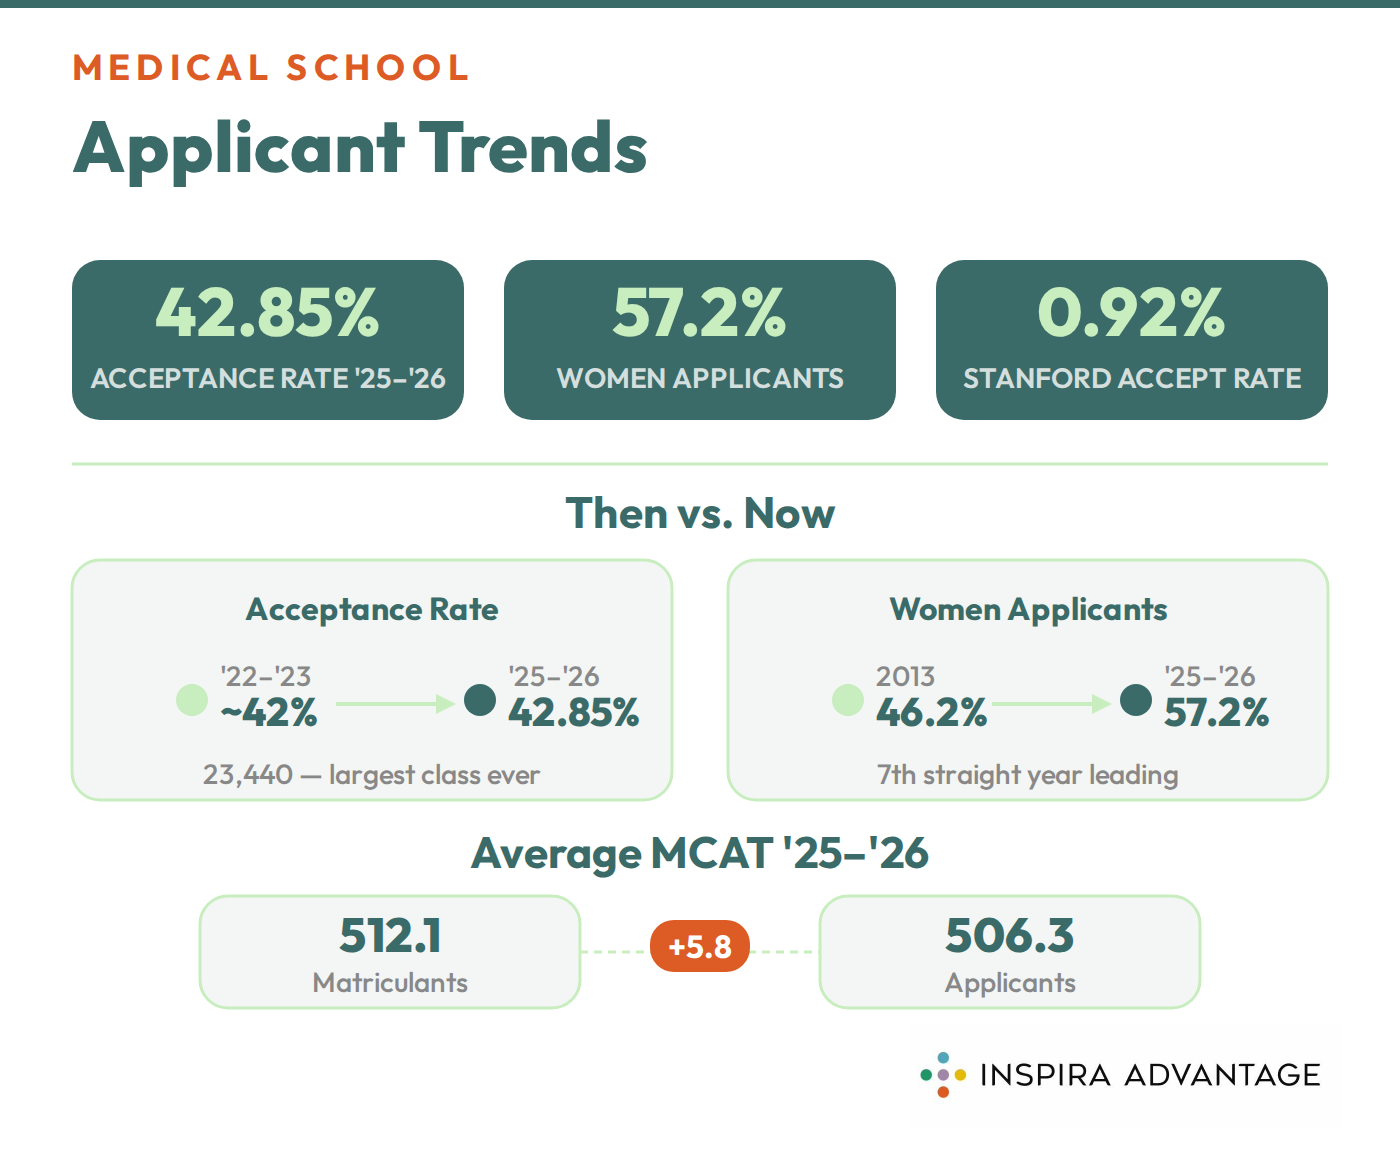
During the 2022-2023 admission cycle, 22,712 of the 55,188 students who applied to medical school matriculated. That means approximately 41% of medical school applicants were accepted into a program, up from the previous year, according to the AAMC.
As of June 2026, the most recent AAMC data shows that in the 2025-2026 cycle, 23,440 of 54,699 applicants matriculated, or about 42.85%. Applications rose 5.3% that year, and the incoming class of 23,440 was the largest on record.
From 2013 to 2022, the number of female medical school applicants increased from 46.2% to 56.5%. In the 2022-2023 academic year, 13.1% more women applied to medical school than men.
As of June 2026, women made up 57.2% of applicants in the 2025-2026 cycle, compared with 42.2% of men, a 15-point gap. That marks the seventh straight year in which women led applicants, matriculants, and total enrollment.
As of June 2026, the most selective medical program in the U.S. is Stanford Medicine, with an acceptance rate of only 0.92%.
In the 2025-2026 admissions cycle, the average MCAT for matriculants was 512.1. Applicants averaged 506.3, so enrolling students still outscore the broader pool by nearly six points.
The cost of becoming a doctor rarely matches the figure on a school's website. Some of the most expensive programs cost nothing to attend, the typical graduate still leaves with six figures of debt, and the loan that once filled the gap is about to disappear.
Here’s what medical school actually costs in 2026:
Tuition rates don't tell you much about what you'll actually pay. NYU Grossman lists tuition at $65,500 per year, yet every admitted MD student receives a full-tuition scholarship.
Albert Einstein went tuition-free after a $1 billion gift, the largest ever to a medical school, and the Cleveland Clinic Lerner and Kaiser Permanente run their own free-tuition models. The catch is that these scholarships cover tuition, not living costs, so NYU students still budget tens of thousands a year for housing, fees, and other expenses.
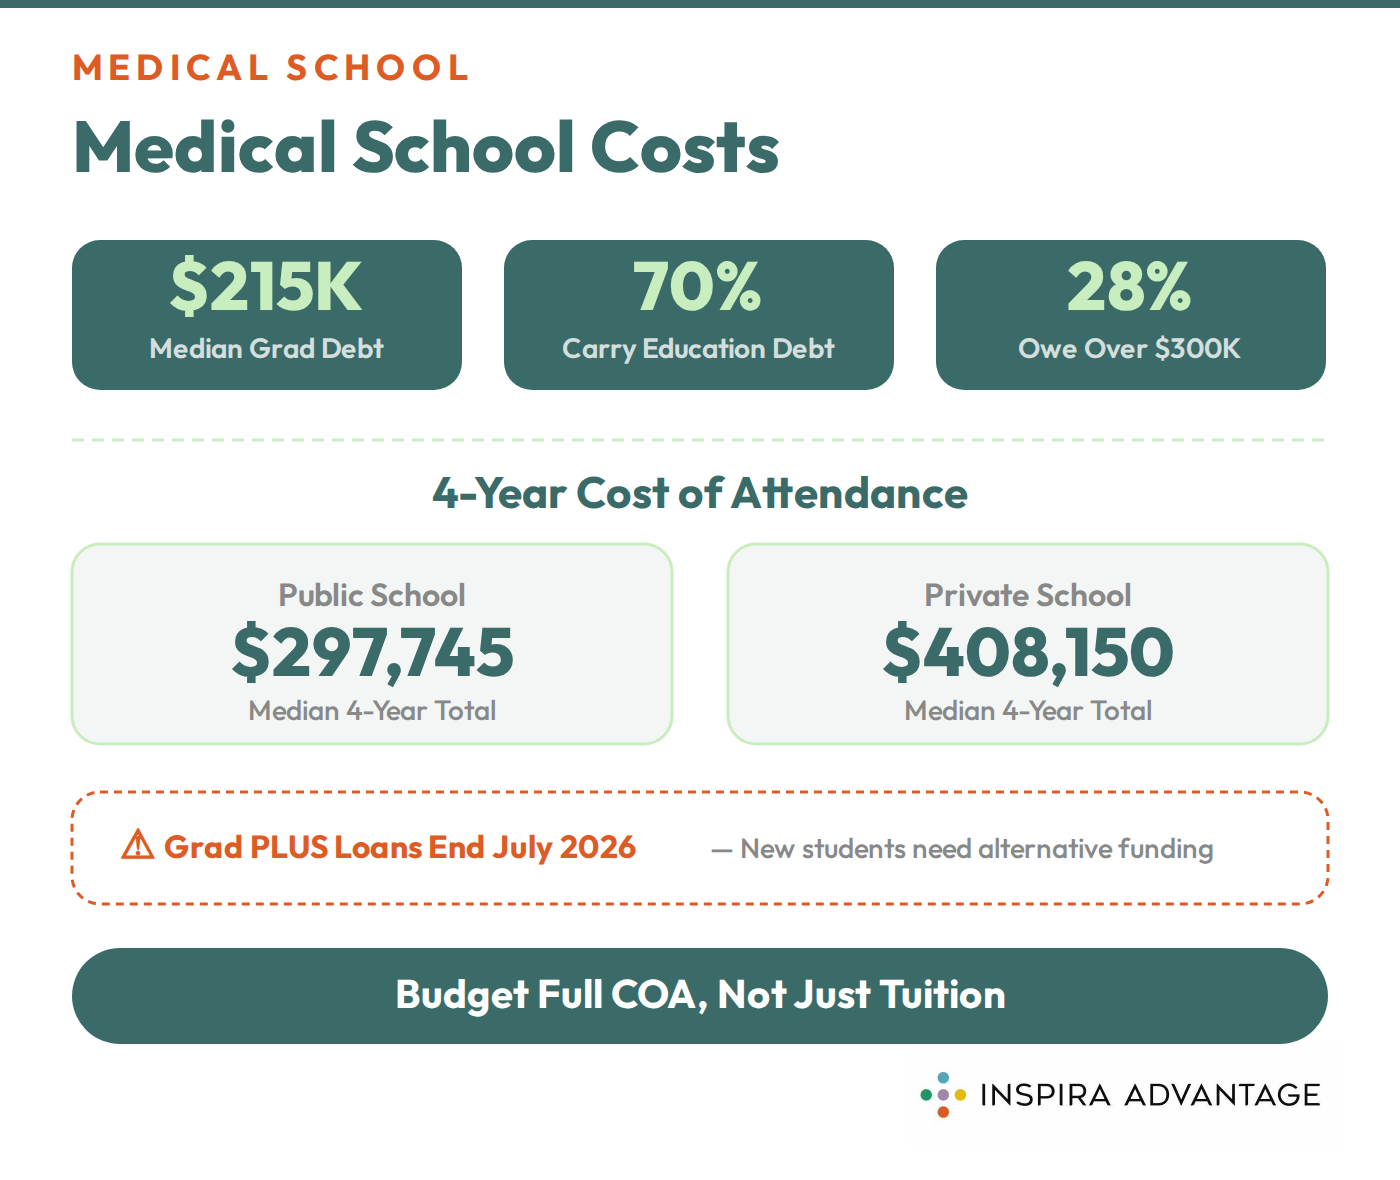
Most new physicians start their careers owing about $215,000. The AAMC reports a median education debt of $215,000 for the class of 2025, with 70% of graduates carrying education debt and 28% owing more than $300,000.
Private-school graduates owe a mean of $244,964, compared with $210,147 for public-school graduates. Because those balances are much higher than a resident's salary, many graduates enter a loan-forgiveness or repayment program. Factor your repayment strategy into your school list before you borrow, not after you graduate.
Four years of medical school costs far more than tuition alone. The AAMC puts the median four-year cost of attendance for the incoming class at $297,745 at public schools and $408,150 at private ones.
Tuition is only a portion of that total, since the median first-year cost of attendance already runs $75,654 at public schools and $106,787 at private schools once you include housing, fees, and living expenses.
Those living costs, not tuition, drive most of the difference between a cheap year and an expensive one. Build your budget around the full cost of attendance. That’s the number your loans actually have to cover.
Among the top 10 MD programs, tuition is roughly $70,000 a year. Stanford Medicine has the highest at $92,884, while the University of Virginia School of Medicine lists $55,054. Public funding keeps state-school tuition lower, but scholarship programs at the wealthiest private schools often erase that advantage for eligible students.
The people filling medical school classrooms look different than they did a decade ago. The 2025-2026 entering class skews older than the typical college senior, leans majority women, and reflects shifting representation across race, ethnicity, and family background.
Here’s what the latest AAMC data shows about who actually gets in:
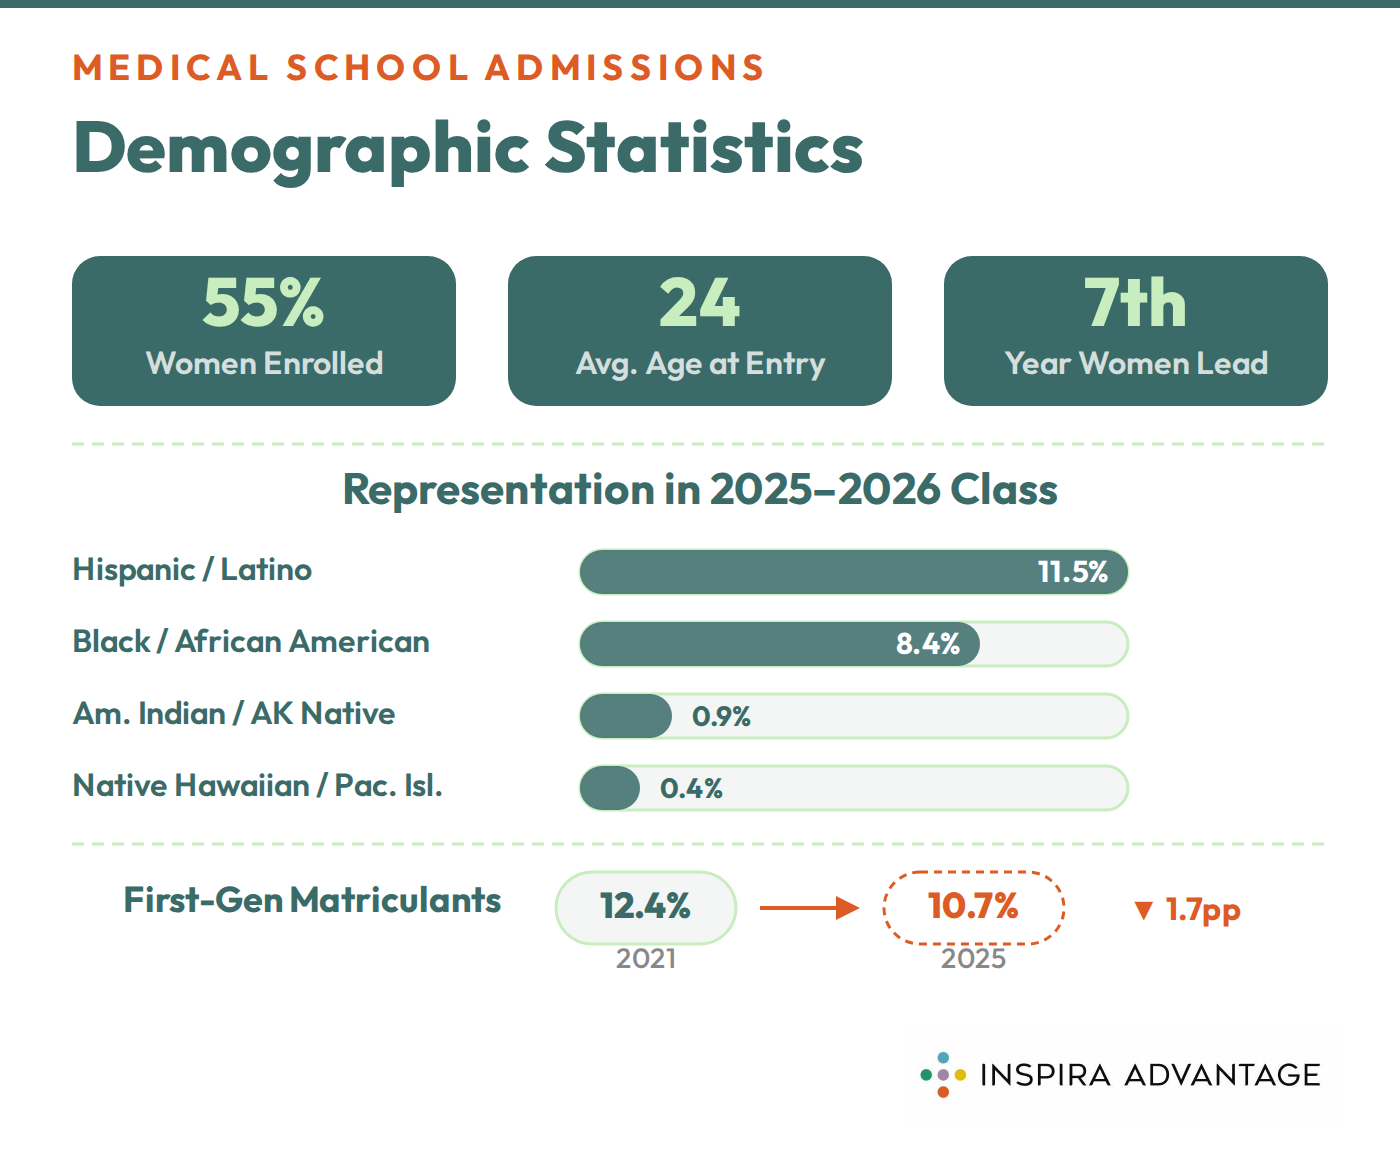
Most students start medical school in their mid-20s, not straight out of college. AAMC data for the 2025-2026 entering class shows matriculants ranging in age from 18 to 60, with 2.6% over age 30.
A typical first-year student lands in the early to mid-20s, and taking at least one gap year between college and medical school has become the norm rather than the exception. Admissions committees read that gap as time you spent strengthening your application through research, clinical work, or a job, so treat the years after graduation as an asset, not a delay.
In the 2025-2026 cycle, women made up 57.2% of applicants, 55.0% of matriculants, and 55.0% of total enrollment, the seventh straight year women held the majority across all three.
Men accounted for 42.2% of applicants and 44.4% of matriculants, and the number of men applying rose for the first time since 2021.
A small share of students report another gender identity, which the AAMC now tracks as its own category.
Among the 2025-2026 entering class, 8.4% of matriculants identified as Black or African American, 11.5% as Hispanic or Latino, 0.9% as American Indian or Alaska Native, and 0.4% as Native Hawaiian or Pacific Islander.
The AAMC changed how it collects race and ethnicity data in 2025-2026, adding a Middle Eastern or North African category, so the new numbers don’t align perfectly with past years.
The year before, matriculants from every underrepresented group declined, several by double digits.
First-generation students make up a decreasing proportion of medical school classes. The share of applicants who were the first in their family to attend college fell from 15.4% in 2021 to 13.8% in 2025, and first-generation matriculants dropped from 12.4% to 10.7% over the same span.
The decline runs counter to schools' stated diversity goals and shows that financial and informational barriers still filter out strong applicants early. If you’re first-gen, rely on free AAMC fee assistance and your prehealth advising office. The applicants who navigate this process well usually have a guide, and you can find one easily.
Work with Inspira's med school admissions specialists to get into a top medical school. Our experts work with you to build a competitive application and get accepted to one of the best schools in the nation.
Dr. Jonathan Preminger was the original author of this article. Snippets of his work may remain.


.svg)


